ACT Science Practice Test 3
Exam Summary
0 of 13 Questions completed
Questions:
Information
You have already completed the exam before. Hence you can not start it again.
Exam is loading…
You must sign in or sign up to start the exam.
You must first complete the following:
Results
Results
0 of 13 Questions answered correctly
Your time:
Time has elapsed
You have reached 0 of 0 point(s), (0)
Earned Point(s): 0 of 0, (0)
0 Essay(s) Pending (Possible Point(s): 0)
| Average score |
|
| Your score |
|
Categories
- Not categorized 0%
-

Need More Help?
Read our reviews of the best ACT prep courses. We reviewed the best providers and have exclusive discounts you can use.
- 1
- 2
- 3
- 4
- 5
- 6
- 7
- 8
- 9
- 10
- 11
- 12
- 13
- Current
- Review
- Answered
- Correct
- Incorrect
-
Question 1 of 13
1. Question
Data Representation (1 of 7)
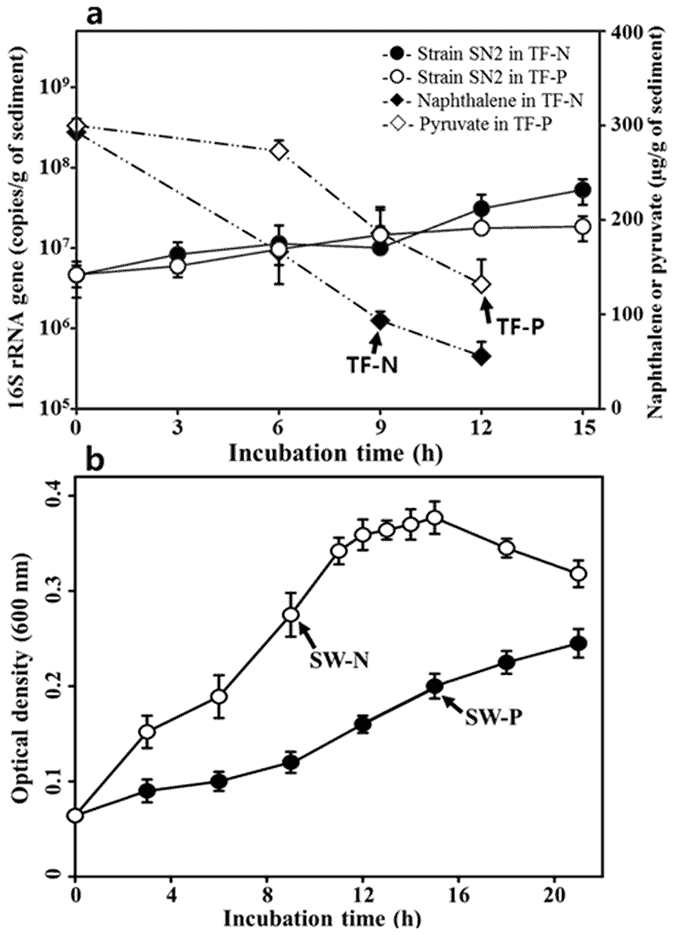
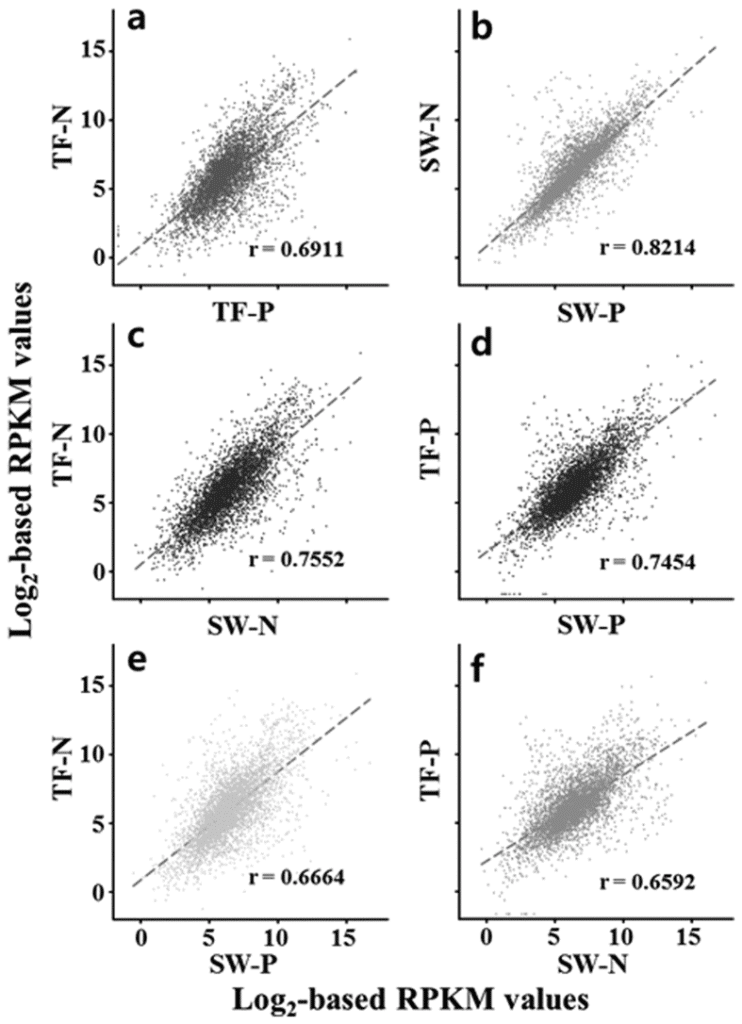
The bacterial strain SN2 (Alteromonas naphthalenivorans) is known to contaminate both tidal flats and seawater. The graphs in Figure 1 show the results of an experiment intended to measure the cell growth of SN2 in a tidal flat environment with added Naphthalene (TF-N) and a tidal flat environment with added Pyruvate (TF-P). The concentration of Naphthalene and Pyruvate were also measured within this experiment. Additionally, changes in the optical density of seawater was measured when both Naphthalene and Pyruvate were added. The goal of this experiment was to better understand the Eco physiological behavior of SN2 in contaminated environments. The graphs in Figure 2 depict levels of correlation in level of gene expression between conditions.

Figure 1

Figure 2
Figures adapted from Genome-wide transcriptional responses of Alteromonas naphthalenivorans SN2 to contaminated seawater and marine tidal flat sediment by Hyun mi Jin et al.
In Figure 1, what is the relationship between Pyruvate concentration and Naphthalene concentration?
CorrectIncorrect -
Question 2 of 13
2. Question
Data Representation (2 of 7)
The bacterial strain SN2 (Alteromonas naphthalenivorans) is known to contaminate both tidal flats and seawater. The graphs in Figure 1 show the results of an experiment intended to measure the cell growth of SN2 in a tidal flat environment with added Naphthalene (TF-N) and a tidal flat environment with added Pyruvate (TF-P). The concentration of Naphthalene and Pyruvate were also measured within this experiment. Additionally, changes in the optical density of seawater was measured when both Naphthalene and Pyruvate were added. The goal of this experiment was to better understand the Eco physiological behavior of SN2 in contaminated environments. The graphs in Figure 2 depict levels of correlation in level of gene expression between conditions.

Figure 1

Figure 2
Figures adapted from Genome-wide transcriptional responses of Alteromonas naphthalenivorans SN2 to contaminated seawater and marine tidal flat sediment by Hyun mi Jin et al.
After 12 hours of incubation, how many copies/g of sediment of the 16S rRNA gene are there of the SN2 strain in the TF-N condition?
CorrectIncorrect -
Question 3 of 13
3. Question
Data Representation (3 of 7)
The bacterial strain SN2 (Alteromonas naphthalenivorans) is known to contaminate both tidal flats and seawater. The graphs in Figure 1 show the results of an experiment intended to measure the cell growth of SN2 in a tidal flat environment with added Naphthalene (TF-N) and a tidal flat environment with added Pyruvate (TF-P). The concentration of Naphthalene and Pyruvate were also measured within this experiment. Additionally, changes in the optical density of seawater was measured when both Naphthalene and Pyruvate were added. The goal of this experiment was to better understand the Eco physiological behavior of SN2 in contaminated environments. The graphs in Figure 2 depict levels of correlation in level of gene expression between conditions.

Figure 1

Figure 2
Figures adapted from Genome-wide transcriptional responses of Alteromonas naphthalenivorans SN2 to contaminated seawater and marine tidal flat sediment by Hyun mi Jin et al.
In Figure 1, what is the relationship between Pyruvate concentration and strain SN2 in TF-P?
CorrectIncorrect -
Question 4 of 13
4. Question
Data Representation (4 of 7)
The bacterial strain SN2 (Alteromonas naphthalenivorans) is known to contaminate both tidal flats and seawater. The graphs in Figure 1 show the results of an experiment intended to measure the cell growth of SN2 in a tidal flat environment with added Naphthalene (TF-N) and a tidal flat environment with added Pyruvate (TF-P). The concentration of Naphthalene and Pyruvate were also measured within this experiment. Additionally, changes in the optical density of seawater was measured when both Naphthalene and Pyruvate were added. The goal of this experiment was to better understand the Eco physiological behavior of SN2 in contaminated environments. The graphs in Figure 2 depict levels of correlation in level of gene expression between conditions.

Figure 1

Figure 2
Figures adapted from Genome-wide transcriptional responses of Alteromonas naphthalenivorans SN2 to contaminated seawater and marine tidal flat sediment by Hyun mi Jin et al.
The highest optical density of the SW-N condition occurs closest to which incubation time?
CorrectIncorrect -
Question 5 of 13
5. Question
Data Representation (5 of 7)
The bacterial strain SN2 (Alteromonas naphthalenivorans) is known to contaminate both tidal flats and seawater. The graphs in Figure 1 show the results of an experiment intended to measure the cell growth of SN2 in a tidal flat environment with added Naphthalene (TF-N) and a tidal flat environment with added Pyruvate (TF-P). The concentration of Naphthalene and Pyruvate were also measured within this experiment. Additionally, changes in the optical density of seawater was measured when both Naphthalene and Pyruvate were added. The goal of this experiment was to better understand the Eco physiological behavior of SN2 in contaminated environments. The graphs in Figure 2 depict levels of correlation in level of gene expression between conditions.

Figure 1

Figure 2
Figures adapted from Genome-wide transcriptional responses of Alteromonas naphthalenivorans SN2 to contaminated seawater and marine tidal flat sediment by Hyun mi Jin et al.
Which answer most closely represents the number of hours a decrease in optical density was observed during the seawater conditions?
CorrectIncorrect -
Question 6 of 13
6. Question
Data Representation (6 of 7)
The bacterial strain SN2 (Alteromonas naphthalenivorans) is known to contaminate both tidal flats and seawater. The graphs in Figure 1 show the results of an experiment intended to measure the cell growth of SN2 in a tidal flat environment with added Naphthalene (TF-N) and a tidal flat environment with added Pyruvate (TF-P). The concentration of Naphthalene and Pyruvate were also measured within this experiment. Additionally, changes in the optical density of seawater was measured when both Naphthalene and Pyruvate were added. The goal of this experiment was to better understand the Eco physiological behavior of SN2 in contaminated environments. The graphs in Figure 2 depict levels of correlation in level of gene expression between conditions.

Figure 1

Figure 2
Figures adapted from Genome-wide transcriptional responses of Alteromonas naphthalenivorans SN2 to contaminated seawater and marine tidal flat sediment by Hyun mi Jin et al.
In Figure 2, which conditions had the highest correlation?
CorrectIncorrect -
Question 7 of 13
7. Question
Data Representation (7 of 7)
The bacterial strain SN2 (Alteromonas naphthalenivorans) is known to contaminate both tidal flats and seawater. The graphs in Figure 1 show the results of an experiment intended to measure the cell growth of SN2 in a tidal flat environment with added Naphthalene (TF-N) and a tidal flat environment with added Pyruvate (TF-P). The concentration of Naphthalene and Pyruvate were also measured within this experiment. Additionally, changes in the optical density of seawater was measured when both Naphthalene and Pyruvate were added. The goal of this experiment was to better understand the Eco physiological behavior of SN2 in contaminated environments. The graphs in Figure 2 depict levels of correlation in level of gene expression between conditions.

Figure 1

Figure 2
Figures adapted from Genome-wide transcriptional responses of Alteromonas naphthalenivorans SN2 to contaminated seawater and marine tidal flat sediment by Hyun mi Jin et al.
In figure 2, which conditions had the lowest correlation?
CorrectIncorrect -
Question 8 of 13
8. Question
Research Summary (1 of 6)
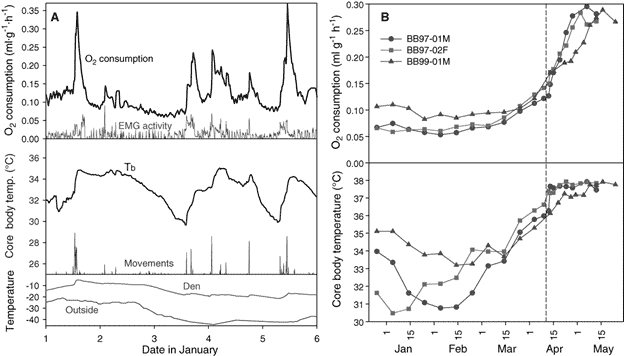
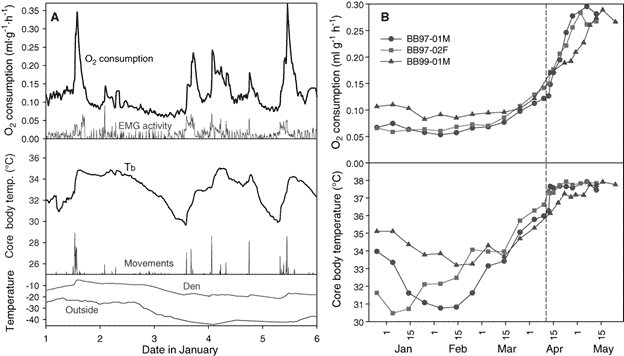
Researchers studied a species of hibernating black Bears. Each year the Black Bears go into hibernation for a 5-7 month period. During this time, they do not consume any food. Researchers explored the metabolic processes that allow black Bears to survive for so long without eating.

Figure 1

Figure 2
Figures adapted from Hibernation in Black Bears: Independence of Metabolic Suppression from Body Temperature by Oivind Toien et al.
Study 1
Researchers gathered black Bears and transported them to facilities in Alaska where they were placed in wooden box habitats. The researchers prepared to measure the Black Bears core body temperature and oxygen consumption during hibernation. Core body temperature was measured through implanted radio transmitters, and oxygen consumption was measured through the constant collection and analysis of air in the habitat. EMG was also surgically implanted to measure electrical activity. Results representative of a typical six-day period during hibernation can be observed in Figure 1.
Study 2
Researchers had additionally installed devices to track the hibernating Black Bears movements including infrared cameras. Once awake, the researchers continued to analyze the Black Bears metabolisms to better understand the process of recovering from hibernation. After having done so, the researchers decided to graph the last several months of hibernation and the post hibernation period, as can be seen in Figure 2. The legend indicates different individual Black Bears. The dashed line indicates the average date the Black Bears woke up from hibernation.
What is the lowest core body temperature observed during hibernation (Figure 2)?
CorrectIncorrect -
Question 9 of 13
9. Question
Research Summary (2 of 6)
Researchers studied a species of hibernating black Bears. Each year the Black Bears go into hibernation for a 5-7 month period. During this time, they do not consume any food. Researchers explored the metabolic processes that allow black Bears to survive for so long without eating.

Figure 1

Figure 2
Figures adapted from Hibernation in Black Bears: Independence of Metabolic Suppression from Body Temperature by Oivind Toien et al.
Study 1
Researchers gathered black Bears and transported them to facilities in Alaska where they were placed in wooden box habitats. The researchers prepared to measure the Black Bears core body temperature and oxygen consumption during hibernation. Core body temperature was measured through implanted radio transmitters, and oxygen consumption was measured through the constant collection and analysis of air in the habitat. EMG was also surgically implanted to measure electrical activity. Results representative of a typical six-day period during hibernation can be observed in Figure 1.
Study 2
Researchers had additionally installed devices to track the hibernating Black Bears movements including infrared cameras. Once awake, the researchers continued to analyze the Black Bears metabolisms to better understand the process of recovering from hibernation. After having done so, the researchers decided to graph the last several months of hibernation and the post hibernation period, as can be seen in Figure 2. The legend indicates different individual Black Bears. The dashed line indicates the average date the Black Bears woke up from hibernation.
What is the highest core body temperature observed during hibernation for BB99-01M (Figure 2)?
CorrectIncorrect -
Question 10 of 13
10. Question
Research Summary (3 of 6)
Researchers studied a species of hibernating black Bears. Each year the Black Bears go into hibernation for a 5-7 month period. During this time, they do not consume any food. Researchers explored the metabolic processes that allow black Bears to survive for so long without eating.

Figure 1

Figure 2
Figures adapted from Hibernation in Black Bears: Independence of Metabolic Suppression from Body Temperature by Oivind Toien et al.
Study 1
Researchers gathered black Bears and transported them to facilities in Alaska where they were placed in wooden box habitats. The researchers prepared to measure the Black Bears core body temperature and oxygen consumption during hibernation. Core body temperature was measured through implanted radio transmitters, and oxygen consumption was measured through the constant collection and analysis of air in the habitat. EMG was also surgically implanted to measure electrical activity. Results representative of a typical six-day period during hibernation can be observed in Figure 1.
Study 2
Researchers had additionally installed devices to track the hibernating Black Bears movements including infrared cameras. Once awake, the researchers continued to analyze the Black Bears metabolisms to better understand the process of recovering from hibernation. After having done so, the researchers decided to graph the last several months of hibernation and the post hibernation period, as can be seen in Figure 2. The legend indicates different individual Black Bears. The dashed line indicates the average date the Black Bears woke up from hibernation.
Why was it important that the researchers tracked the hibernating bear’s movements in study 2?
CorrectIncorrect -
Question 11 of 13
11. Question
Research Summary (4 of 6)
Researchers studied a species of hibernating black Bears. Each year the Black Bears go into hibernation for a 5-7 month period. During this time, they do not consume any food. Researchers explored the metabolic processes that allow black Bears to survive for so long without eating.

Figure 1

Figure 2
Figures adapted from Hibernation in Black Bears: Independence of Metabolic Suppression from Body Temperature by Oivind Toien et al.
Study 1
Researchers gathered black Bears and transported them to facilities in Alaska where they were placed in wooden box habitats. The researchers prepared to measure the Black Bears core body temperature and oxygen consumption during hibernation. Core body temperature was measured through implanted radio transmitters, and oxygen consumption was measured through the constant collection and analysis of air in the habitat. EMG was also surgically implanted to measure electrical activity. Results representative of a typical six-day period during hibernation can be observed in Figure 1.
Study 2
Researchers had additionally installed devices to track the hibernating Black Bears movements including infrared cameras. Once awake, the researchers continued to analyze the Black Bears metabolisms to better understand the process of recovering from hibernation. After having done so, the researchers decided to graph the last several months of hibernation and the post hibernation period, as can be seen in Figure 2. The legend indicates different individual Black Bears. The dashed line indicates the average date the Black Bears woke up from hibernation.
What is suggested by the differences in core body temperature between all three Black Bears in Figure 2?
CorrectIncorrect -
Question 12 of 13
12. Question
Research Summary (5 of 6)
Researchers studied a species of hibernating black Bears. Each year the Black Bears go into hibernation for a 5-7 month period. During this time, they do not consume any food. Researchers explored the metabolic processes that allow black Bears to survive for so long without eating.

Figure 1

Figure 2
Figures adapted from Hibernation in Black Bears: Independence of Metabolic Suppression from Body Temperature by Oivind Toien et al.
Study 1
Researchers gathered black Bears and transported them to facilities in Alaska where they were placed in wooden box habitats. The researchers prepared to measure the Black Bears core body temperature and oxygen consumption during hibernation. Core body temperature was measured through implanted radio transmitters, and oxygen consumption was measured through the constant collection and analysis of air in the habitat. EMG was also surgically implanted to measure electrical activity. Results representative of a typical six-day period during hibernation can be observed in Figure 1.
Study 2
Researchers had additionally installed devices to track the hibernating Black Bears movements including infrared cameras. Once awake, the researchers continued to analyze the Black Bears metabolisms to better understand the process of recovering from hibernation. After having done so, the researchers decided to graph the last several months of hibernation and the post hibernation period, as can be seen in Figure 2. The legend indicates different individual Black Bears. The dashed line indicates the average date the Black Bears woke up from hibernation.
Once awoken, what happens to the Black Bears?
CorrectIncorrect -
Question 13 of 13
13. Question
Research Summary (6 of 6)
Researchers studied a species of hibernating black Bears. Each year the Black Bears go into hibernation for a 5-7 month period. During this time, they do not consume any food. Researchers explored the metabolic processes that allow black Bears to survive for so long without eating.

Figure 1

Figure 2
Figures adapted from Hibernation in Black Bears: Independence of Metabolic Suppression from Body Temperature by Oivind Toien et al.
Study 1
Researchers gathered black Bears and transported them to facilities in Alaska where they were placed in wooden box habitats. The researchers prepared to measure the Black Bears core body temperature and oxygen consumption during hibernation. Core body temperature was measured through implanted radio transmitters, and oxygen consumption was measured through the constant collection and analysis of air in the habitat. EMG was also surgically implanted to measure electrical activity. Results representative of a typical six-day period during hibernation can be observed in Figure 1.
Study 2
Researchers had additionally installed devices to track the hibernating Black Bears movements including infrared cameras. Once awake, the researchers continued to analyze the Black Bears metabolisms to better understand the process of recovering from hibernation. After having done so, the researchers decided to graph the last several months of hibernation and the post hibernation period, as can be seen in Figure 2. The legend indicates different individual Black Bears. The dashed line indicates the average date the Black Bears woke up from hibernation.
One of the researchers hypothesized that if the same study were performed again the following year with three new Black Bears instead of the Black Bears from the current studies, the pattern of oxygen consumption would be relatively the same. Do the results of the study support this hypothesis?
CorrectIncorrect
